Give your users more freedom with Data Grid row grouping
After an incredible year fully focused on improving our Data Grid component, we are moving forward by launching the first feature of our new Premium plan: row grouping, released in v5.3.0.
Let's take a closer look at this feature.
Navigate your data 🚢
If you already use the Pro plan, you may be familiar with the tree data which allows your users to navigate in the hierarchy by opening and closing children of a row.
But not all data has a natural hierarchy, and your users might need to modify the order.
Good news! This is now possible with row grouping.
Row grouping in action
Consider this sample data of the top 250 movies according to IMDb. Would you group them by director, box office results, or year of release?
The answer depends on what the user wants to do. So give them the freedom to choose!
With the new row grouping feature, you can click on the Director column menu and select Group by Director to group all the rows with the same director.
When you're ready to return to the default view, click on Stop Grouping by Director in the same column menu.
How to unlock this feature 🔓🎁
The row grouping feature will be part of the Premium plan when it is launched. For now, you can access it on the Pro plan by enabling experimental features.
<DataGridPro experimentalFeatures={{ rowGrouping: true }} {...otherProps} />
Note: Row grouping is stable in its current form. The experimental flag is here to make sure that the Pro plan will not have any regression when the feature is eventually moved to the Premium plan.
How to set the default grouping ⚡️
Save your users time by defining the initial grouping. To do so, specify the row grouping model in the initialState prop.
For a page with information about directors, we could group by director and box office as follows:
<DataGridPro
  experimentalFeatures={{ rowGrouping: true }}
  initialState={{
    rowGrouping: {
      model: ['Director', 'BoxOffice'],
    },
  }}
  {...otherProps}
/>
You can still modify this grouping configuration in the column menus.
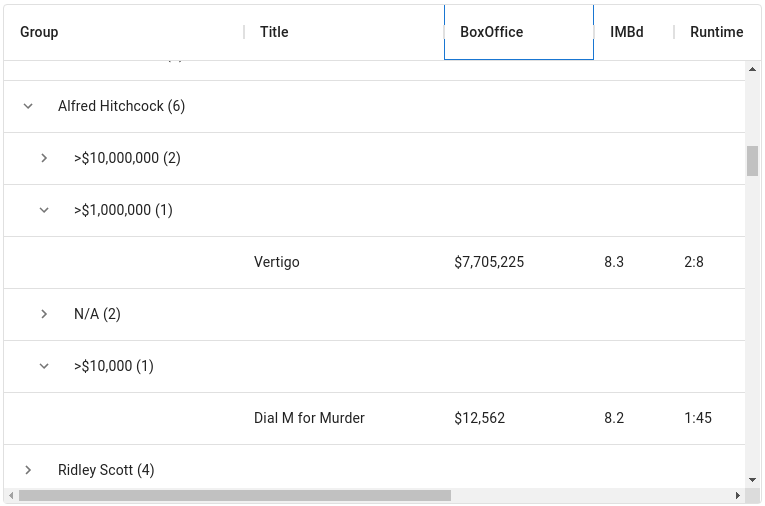
But as you can see in the example below, setting the default grouping allows us to hone in on the data we find most interesting, such as the box office results of Hitchcock's films:

Cherry-pick the groupable columns 🍒
Before letting your users enjoy this new feature, let's adapt it to your use case.
Not all columns will be ideal candidates. Row grouping is most useful when information is repeated in a given column, such as the names of movie directors.
In our example of the top 250 movies, grouping by title does not make sense—each movie has a different name, so there will be no row groups.
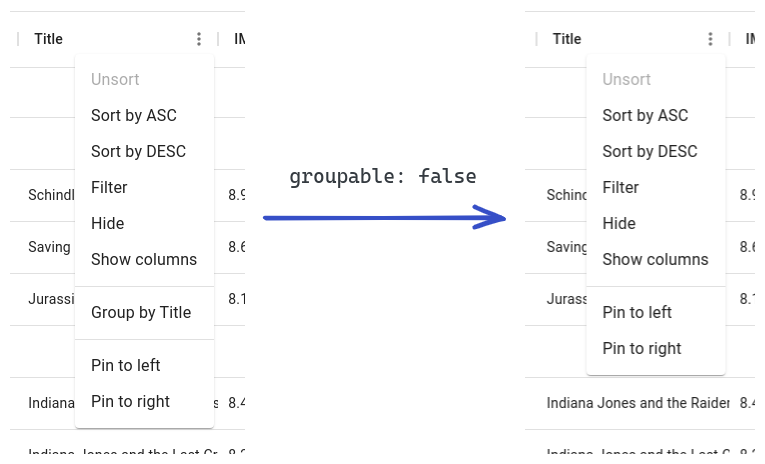
You can remove the ability to group a specific column by setting the property groupable to false in the column definition.
This removes the Group by option in the corresponding column menu.

Customize grouping behavior 🔧
Some columns are interesting, but don't lend themselves well to grouping.
For example, the release date of a movie is interesting information, but grouping by the exact date leads to one group per movie (except for The Thing and Blade Runner, which as we all know were both released on June 25th, 1982 😅).
It is more interesting to group them by decade.
For this purpose, the column definitions accept the property groupingValueGetter.
Its signature is similar to valueGetter and it returns the grouping value associated with the column.
To group our movies by decade, we could use the following:
groupingValueGetter: ({ value }) => `${Math.floor(value.getFullYear() / 10)}0's`;
Share your feedback 🗣
We hope you find this new feature useful. Please don't hesitate to open issues to share feedback, report bugs, or propose enhancements.
More details about row grouping customization can be found in the documentation.
For more information about our v5.3.0 release, visit the changelog.