Skip to content
+

Toolpad Core - Tutorial

Learn how to use Toolpad Core through an illustrative example dashboard.

Bootstrapping


  1. To choose a project name and create a basic project for this tutorial, run:
npx create-toolpad-app@latest --example core-tutorial
  1. To start the basic project on http://localhost:3000, run:
cd <project-name>
npm install && npm run dev
  1. The following splash screen appears:
Toolpad Core entry point

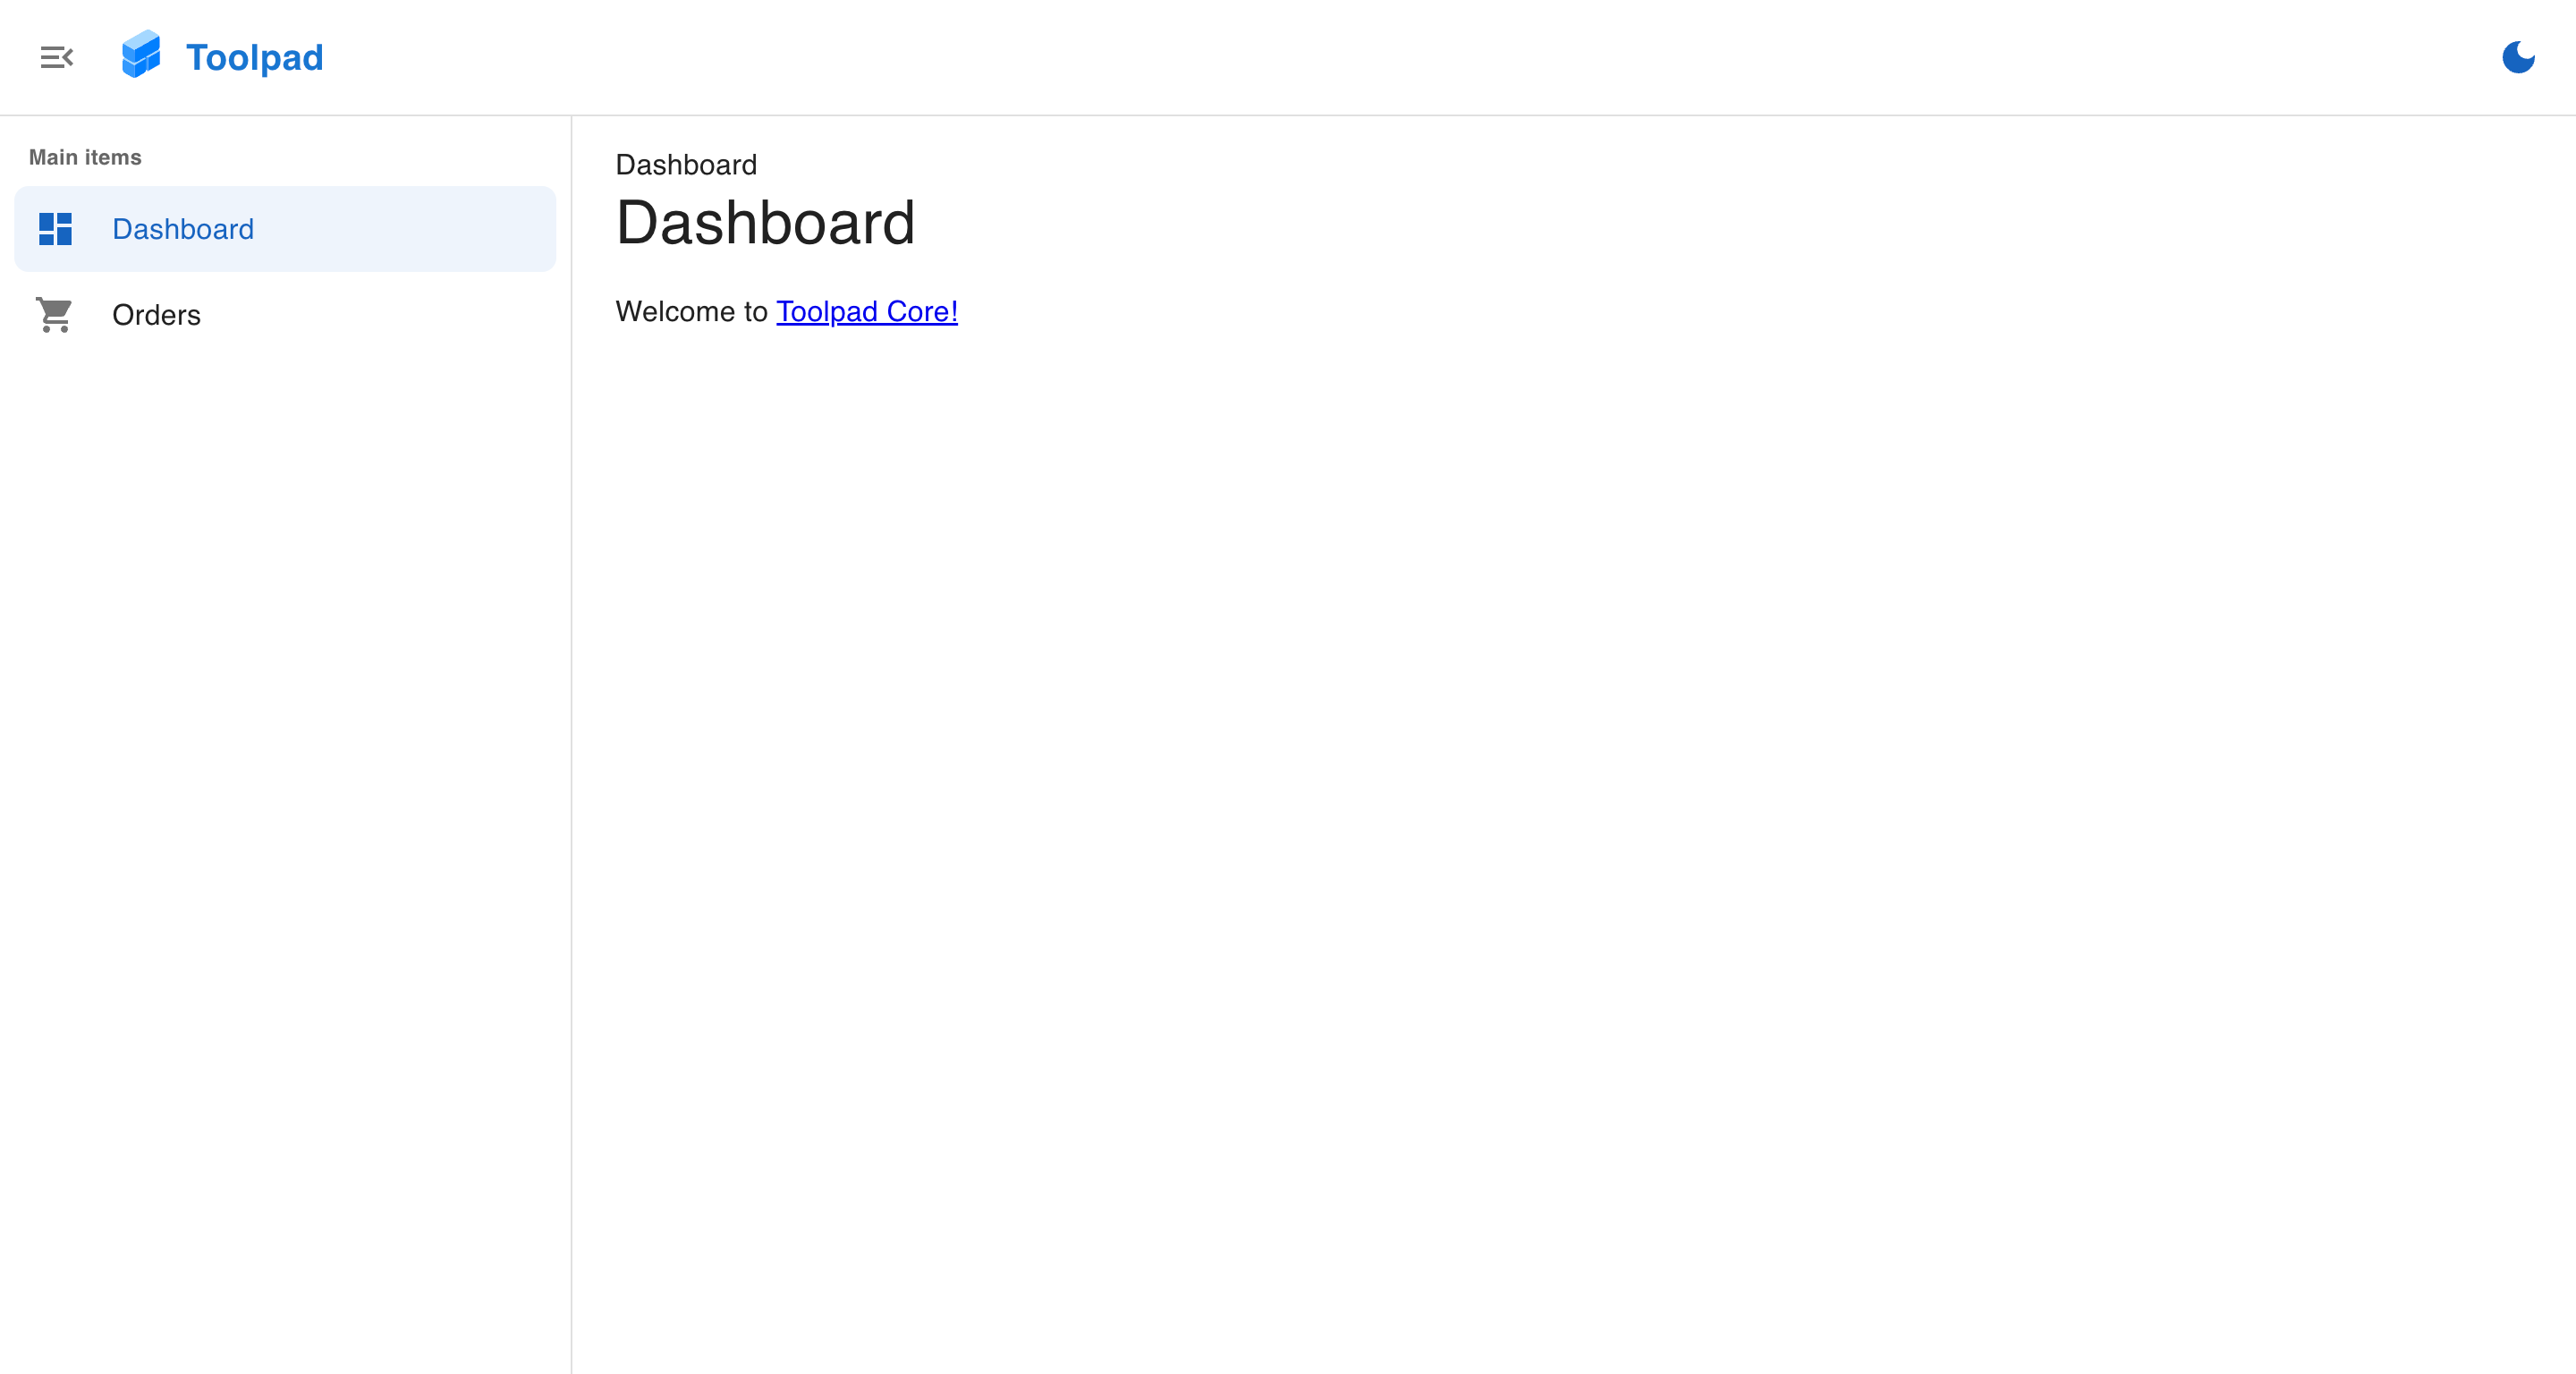
Starting with Toolpad Core

  1. The app has one page already created, which can be viewed by clicking on the "Go to page" button. The following page should appear:

Create a new page


  1. To add a new page and make it appear in the sidebar navigation, create a new folder within the (dashboard) directory titled page-2 and add the following content to page.tsx inside it:
import { Typography, Container } from '@mui/material';
export default function Home() {
  return (
    <main>
      <Container sx={{ mx: 4 }}>
        <Typography variant="h6" color="grey.800">
          This is page 2!
        </Typography>
      </Container>
    </main>
  );
}
  1. Add the newly created page to the sidebar navigation by adding the following code to the navigation items array in app/layout.tsx:
const NAVIGATION: Navigation = [
  {
    kind: 'header',
    title: 'Main items',
  },
  {
    slug: '/page',
    title: 'Page',
    icon: <DashboardIcon />,
  },
  // Add the following new item:
  {
    slug: '/page-2',
    title: 'Page 2',
    icon: <TimelineIcon />,
  },
];

The newly created page can now be navigated to from the sidebar, like the following:

Dashboard content

Now that your project is set up, it's time to build your first dashboard. This part of the tutorial takes you through building a small dashboard that allows monitoring npm downloads.

Connecting to a data source

Toolpad Core comes with the concept of data providers. At its core, you could look at a data provider as an abstraction over a remote collection. At the very least, a data provider implements the getMany method and defines the fields it returns. The getMany method must return an object with a rows property:

import { createDataProvider } from '@toolpad/core/DataProvider';

const npmData = createDataProvider({
  async getMany({ filter }) {
    const res = await fetch(
      `https://api.npmjs.org/downloads/range/${encodeURIComponent(filter.range?.equals ?? 'last-month')}/react`,
    );
    if (!res.ok) {
      const { error } = await res.json();
      throw new Error(`HTTP ${res.status}: ${error}`);
    }
    const { downloads } = await res.json();
    return { rows: downloads };
  },
  idField: 'day',
  fields: {
    day: { type: 'date' },
    downloads: { type: 'number' },
  },
});

This data provider calls the npm API and returns the downloads collection. It defines the two fields available in this collection, day, which we mark as the unique id field with the idField property and downloads. You can then visualize this data by connecting it to a grid:

import { DataGrid } from '@toolpad/core';
import { Stack } from '@mui/material';

// ...

export default function App() {
  return (
    <Stack sx={{ width: '100%' }} spacing={2}>
      <DataGrid height={300} dataProvider={npmData} />
    </Stack>
  );
}

This results in the following output

You don't need to configure any columns, the grid infers them from the data provider. Any default that you define in the fields is adopted by any data rendering component that uses this data provider.

Sharing data providers

Interesting things happen when you share data providers between different components. For instance, you can add a chart that uses the same data. Similar to the grid, this chart displays the same data as the grid. Under the hood the data fetching happens only once.

// ...
import { DataGrid, LineChart } from '@toolpad/core';

// ...

export default function App() {
  return (
    <Stack sx={{ width: '100%' }} spacing={2}>
      <DataGrid height={300} dataProvider={npmData} />
      <LineChart
        height={300}
        dataProvider={npmData}
        xAxis={[{ dataKey: 'day' }]}
        series={[{ dataKey: 'downloads' }]}
      />
    </Stack>
  );
}

The Toolpad Core components automatically adopt default values. For instance, if you add a label to the field, both the grid uses it in the column header, and the chart uses it in the legend:

  // ...
  fields: {
    day: { type: 'date' },
    downloads: { type: 'number', label: 'Npm Downloads' },
  },
  // ...

The result is the following:

Global Filtering

Wrap the dashboard with a DataContext to apply global filtering:

const [range, setRange] = React.useState('last-month');
const filter = React.useMemo(() => ({ range: { equals: range } }), [range]);

// ...

return (
  <Stack sx={{ width: '100%' }} spacing={2}>
    <DataContext filter={filter}>
      <Toolbar disableGutters>
        <TextField
          select
          label="Range"
          value={range}
          onChange={(e) => setRange(e.target.value)}
        >
          <MenuItem value="last-month">Last Month</MenuItem>
          <MenuItem value="last-year">Last Year</MenuItem>
        </TextField>
      </Toolbar>
      {/* ... */}
    </DataContext>
  </Stack>
);

Any data provider that is used under this context now by default applies this filter.